The Operational Experience Crisis
Insights from the State of Application Strategy Report 2025
Introduction
As organizations pursue speed, security, and efficiency in delivering digital services, operational complexity has become a primary obstacle. Increasing reliance on multicloud, distributed apps, and hybrid architectures exposes IT operations teams to time-consuming tasks and fragmented workflows. Traditional metrics fail to capture the cumulative friction operators face daily.
To bridge this gap, we introduce the Operational Experience Score (OES), a composite metric designed to quantify operational pain and highlight where automation, particularly AI-driven operations (AIOps), becomes essential. This score provides a clear, data-driven view into how efficiently IT teams operate and where bottlenecks and inefficiencies lie.
Methodology and scoring formula
We researched how other technical domains measure “experience” and from that, derived a formula that aggregates data across three pillars:
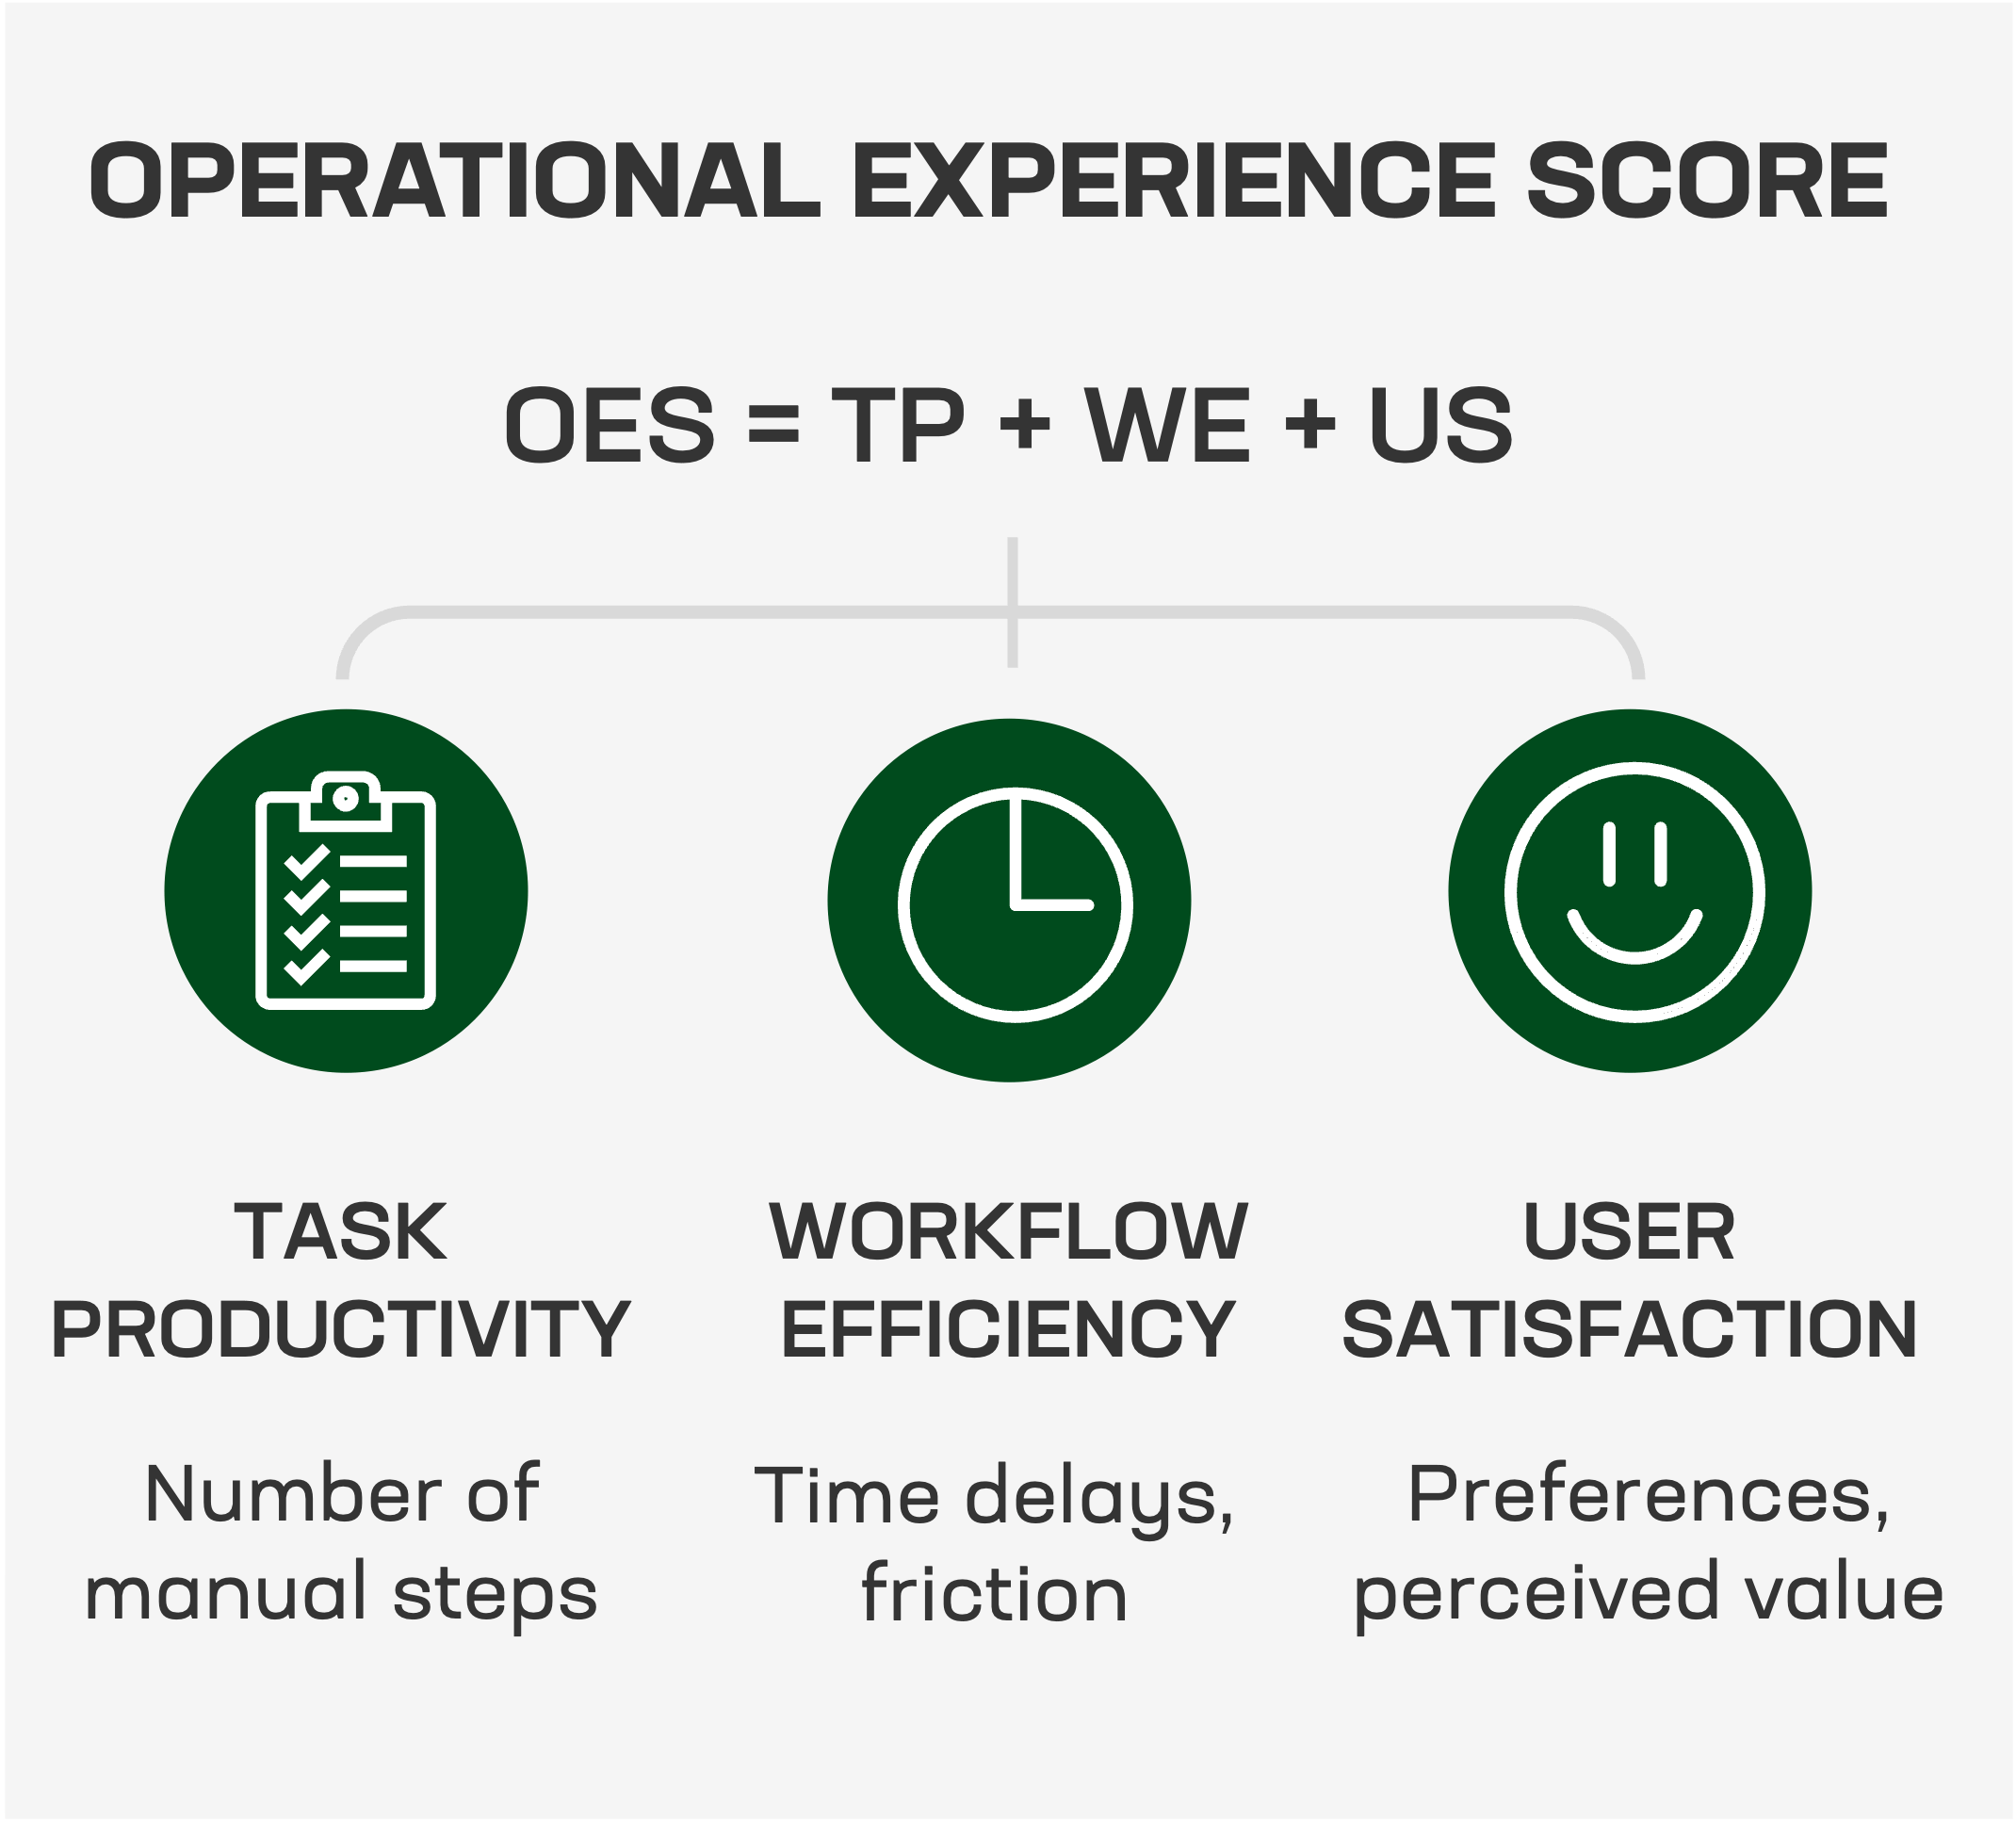
- Task Productivity (TP) – This measures the amount of manual effort required to complete tasks. If teams rely heavily on writing scripts, interacting directly with APIs, or manually approving routine actions, TP will score poorly.
- Workflow Efficiency (WE) – This considers the time and complexity of executing tasks. A high WE score reflects longer turnaround times due to fragmented tools, process delays, or high dependency on human intervention.
- User Satisfaction (US) – Captures how satisfied practitioners are with their tools and workflows, including openness to automation, ease of configuration, and confidence in results.
This approach rewards higher satisfaction and penalizes environments where manual effort and inefficiency dominate. We call this the Operational Experience Score.
Across all respondents, the average OES was 5.50, with significant variation by industry segment. Below are the results:
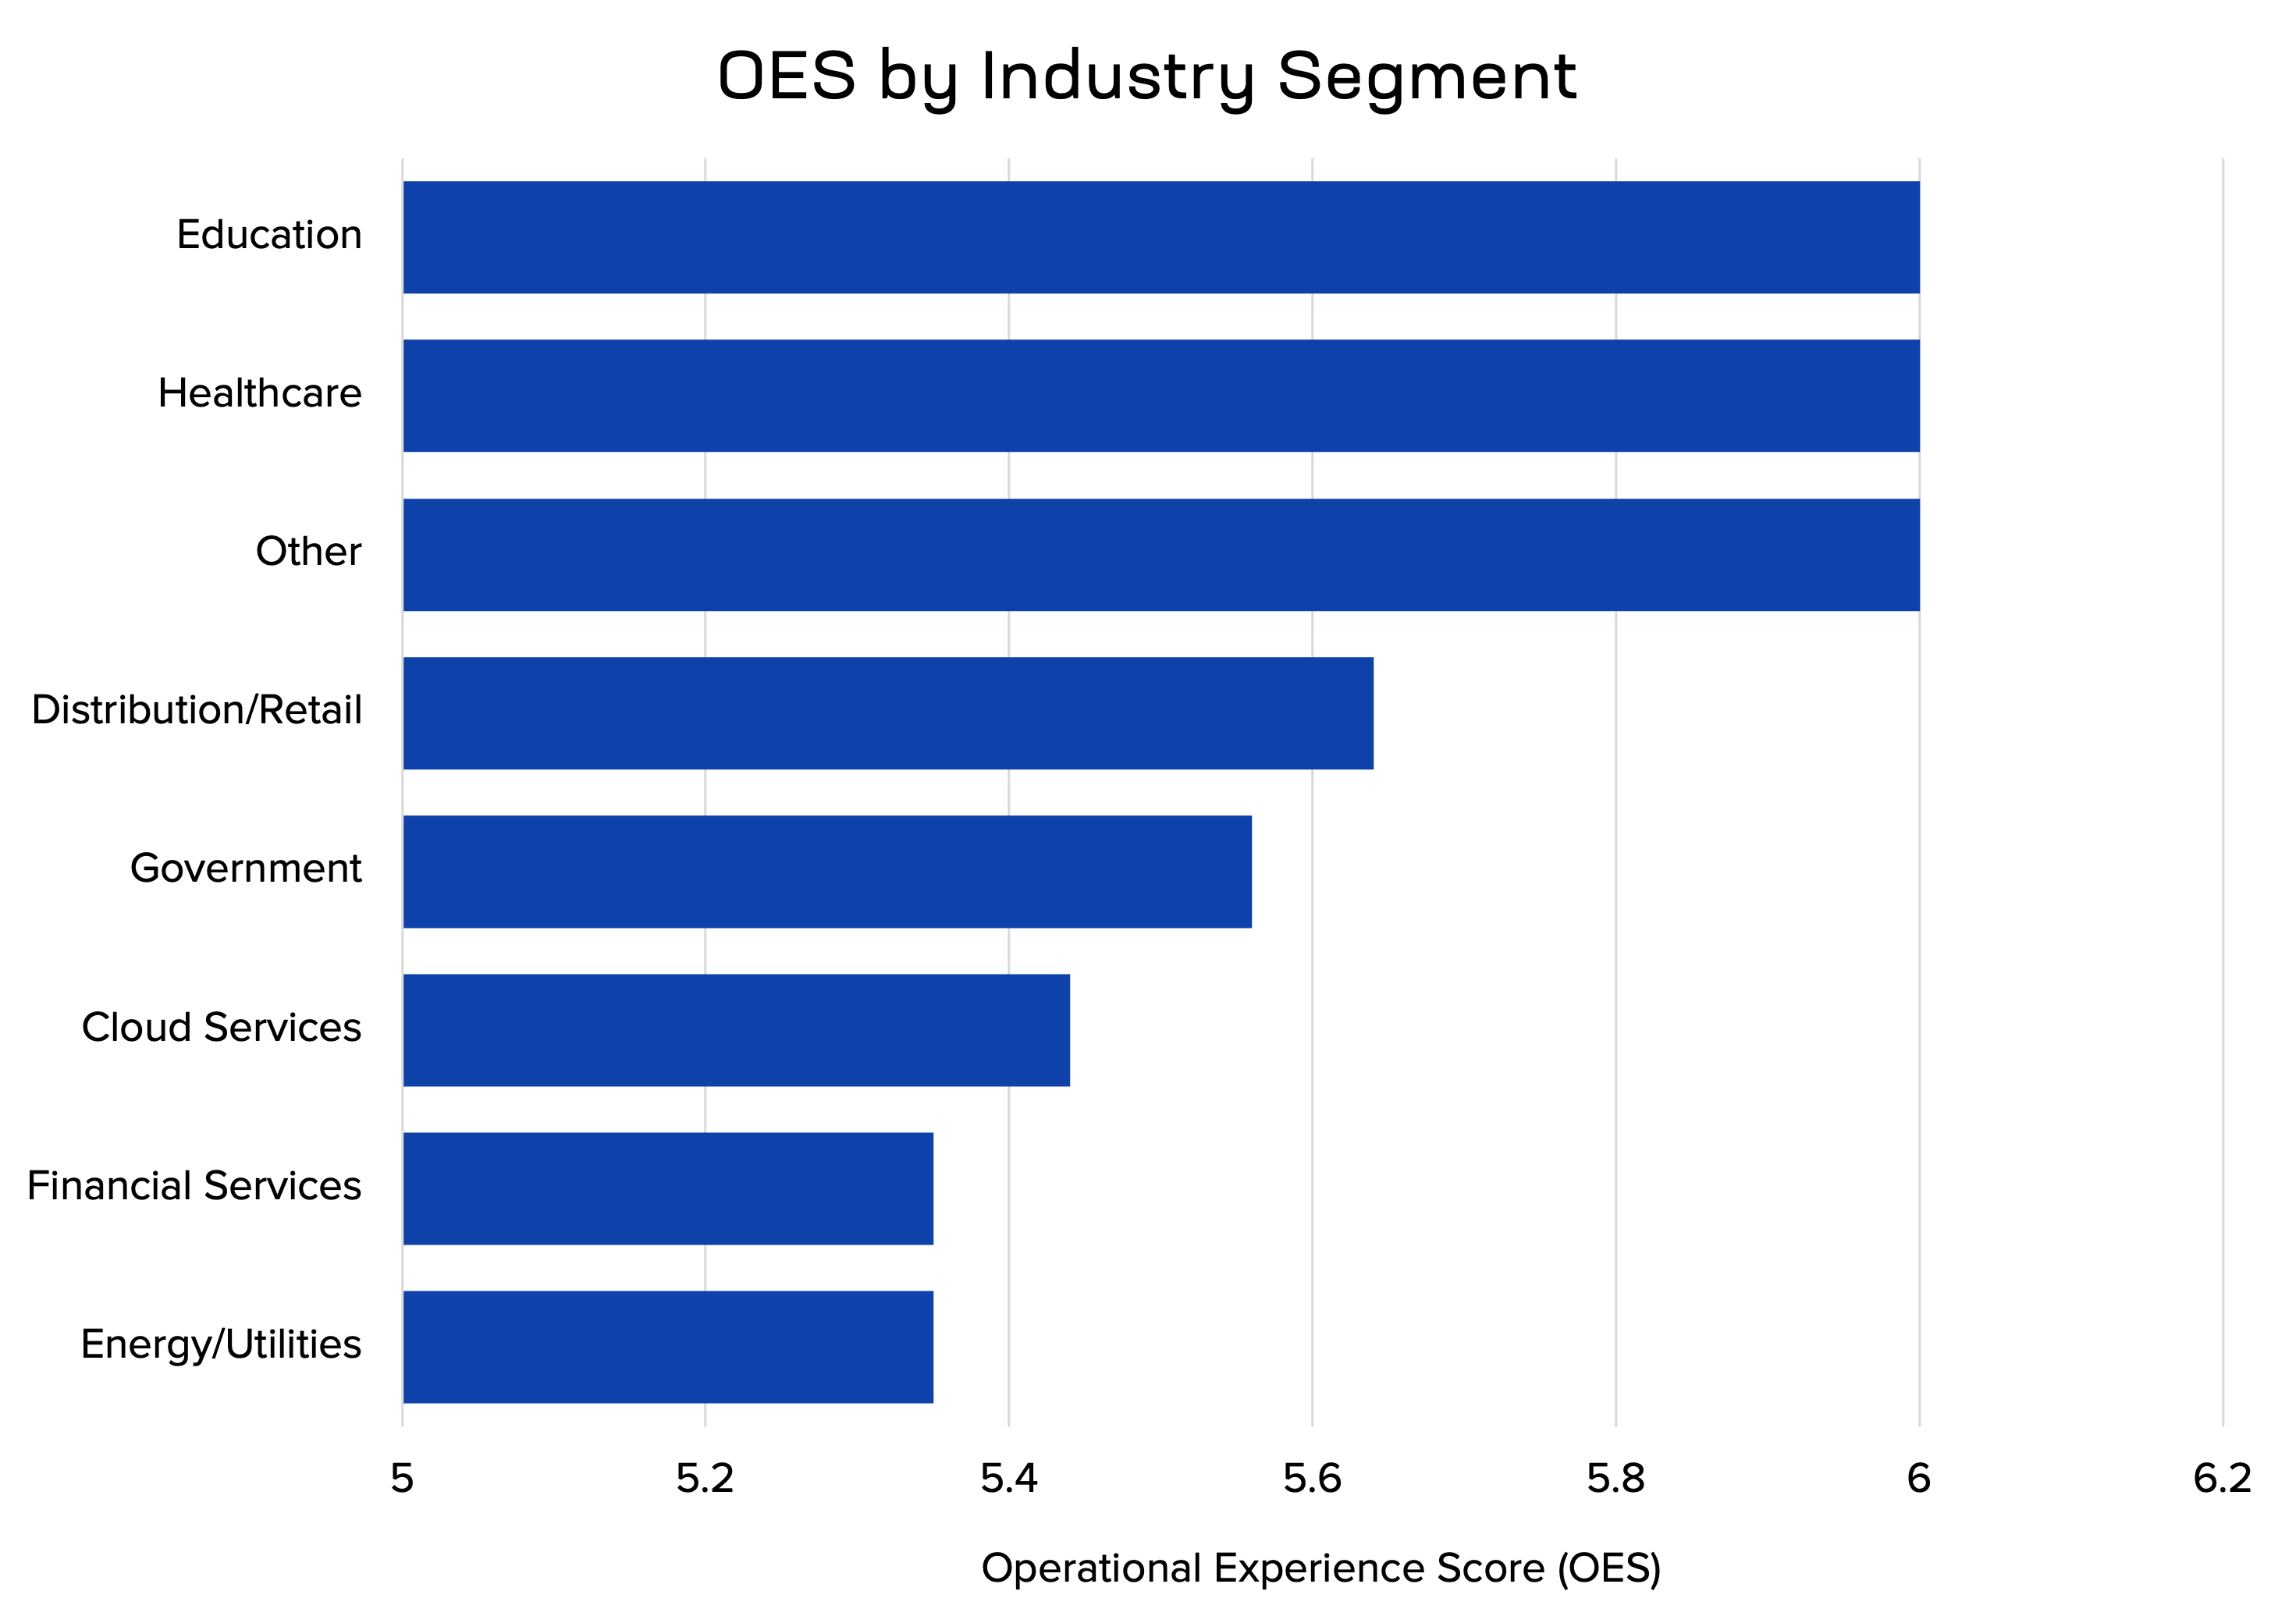
The max possible OES score is 10, where 10 = optimal experience (low task complexity, high efficiency, high satisfaction) and 1 = poor experience (high complexity, low efficiency, low satisfaction).
Key takeaways
- 41% of respondents said "working with vendor APIs" or "writing scripts" is the most time-consuming part of their job.
- 38% want AI to automatically adjust configurations and policies.
- 56% seek AI-generated suggestions to speed workflows.
- Only 6% reported that they do not want to use AI in their automation workflows.
One trend that stands out in this data is the notably lower OES observed in highly regulated industries. Financial services, government, and energy/utilities sectors consistently show greater operational friction. This is not entirely surprising. These industries operate under strict compliance frameworks that often require manual checks, rigid approval processes, and slower change cycles. As a result, even if automation tools are available, teams may be restricted from fully leveraging them.
Additionally, legacy infrastructure tends to persist longer in regulated environments, introducing integration and modernization challenges that impact workflow efficiency. And while practitioners in these sectors may be eager to embrace AI, policy and risk aversion often delay adoption. The OES metric makes this friction visible and underscores the critical role that well-governed AIOps can play in easing the burden of compliance while still accelerating delivery.
Distribution + scale = operational drag
Modern application environments are complex, not just in where they’re deployed, but in how much they carry. Most organizations now span multiple infrastructure types: public cloud, private data centers, colocation, edge, and SaaS. At the same time, they’re managing dozens to hundreds of applications across those environments.
To quantify the impact, we looked at two key variables:
- Distributedness: the number of different environments in which applications are deployed.
- Scale: the total number of applications managed.
What the data shows:
- Correlation between distributedness and OES: –0.22
This negative relationship indicates that as applications are deployed across more environments, operational experience declines. Each environment introduces unique tooling, policies, and integration challenges, fragmenting control and slowing response. - Correlation between application count and OES: +0.05
On its own, application volume has a negligible correlation with operational friction. But when combined with distribution, it paints a clearer picture: organizations with both many apps and many environments suffer the lowest OES scores.
Application scale adds vertical pressure: more apps mean more configs, policies, and updates to manage. Distribution adds horizontal complexity: more environments require more integrations, visibility tools, and specialized expertise.
Put together, they create a compounding drag on operational velocity.
Industries like Financial Services, Energy, and Manufacturing, which score lowest on OES, are also among those with the highest distribution and application scale. In contrast, Education and Healthcare, which typically have fewer applications and simpler infrastructure topologies, report significantly higher OES scores.
Why it matters
Operational teams aren’t just dealing with complexity, they’re drowning in it. The more fragmented and scaled an environment becomes, the more brittle the workflows, the more delayed the response, and the more critical the need for automation.
Operational pain points
The Operational Experience Score isn’t just a number, it’s a reflection of the real challenges that IT and operations teams face in managing modern, distributed, and often fragmented environments. When we examine the broader patterns in the data, several themes emerge that help explain both the pain points and the urgency around automation and AIOps adoption.
1. Manual tasks still dominate
Despite years of investment in automation tooling, a significant portion of operational work remains manual. This isn’t just about legacy systems, it's also about the gaps between tools, the lack of standardization, and the friction introduced by scripts and APIs that were never meant to scale.
- 41% of respondents said that interacting with vendor APIs or writing scripts is the most time-consuming task in their workflow.
- Even in cloud-native organizations, automation often means "a collection of scripts," not streamlined orchestration.
This signals a critical need for more intelligent, adaptable automation, the kind that reduces dependency on hardcoded logic and tribal knowledge.
2. Workflow inefficiencies are systemic
The data reveals that delays and inefficiencies are not isolated to a specific tool or process. Rather, they are systemic and structural, caused by fragmented approval chains, process silos, and non-integrated systems.
- Nearly 30% of respondents cited waiting for approvals or handoffs as a key contributor to delays.
- 18% reported that poor integration across tools was a major source of inefficiency.
This demonstrates that improving workflow efficiency isn't just about deploying more tools, it's about reimagining processes and creating feedback loops that reduce latency between intent and action.
3. High openness to AI, driven by friction
While automation maturity varies, openness to AI tools is consistently strong across roles and industries. This interest isn’t hypothetical, it correlates strongly with areas of high operational friction.
- The correlation between AI interest and OES is –0.62, meaning those in the most pain are the most ready for AI intervention.
- Teams want AI not to replace humans, but to reduce the cognitive load of repetitive, error-prone work: log summarization, policy generation, status reporting, auto-scaling, etc.
This willingness suggests a powerful opportunity: AIOps adoption can be accelerated bottom-up by empowering the very teams who are feeling the most strain.
4. Complexity grows with both scale and distribution
The combined impact of application scale and distributed infrastructure creates a unique operational challenge. While each factor alone has a limited effect on OES, together they produce measurable friction.
- Industries with both high application counts and multi-environment deployments (e.g., Financial Services, Energy, Manufacturing) scored lowest on OES.
- In contrast, sectors like Education and Healthcare, where app portfolios and environment diversity are smaller, scored significantly higher.
This reinforces that complexity is a compound function: it increases as scale (vertical burden) and distribution (horizontal sprawl) rise. And it’s here that automation, especially AIOps, becomes not just useful, but essential.
5. The status quo is unsustainable
Perhaps the most striking insight is that many teams are nearing an inflection point. The combination of growing demands, static headcount, legacy tools, and manual workarounds is producing unsustainable operational pressure.
- Teams are signaling burnout.
- The desire for AI is pragmatic, not aspirational.
- And the willingness to adopt change is already in motion.
The data speaks clearly: the path forward is not more scripts, more tools, or more dashboards, it’s intelligent, context-aware automation that can evolve with operational needs.
The prescription is AI
To better understand how AI fits into operational experience, we analyzed responses to questions about AI and automation, specifically, where respondents wanted to apply AI or expressed willingness to use it in operations. We then compared the number of positive AI-related responses to each respondent’s Operational Experience Score (OES).
- Correlation between AI interest and OES: -0.62
This is a strong negative correlation, indicating a clear pattern: the more operational pain a team experiences, the more they want AI to help. In other words, those most eager for AI assistance, whether for summarizing logs, tuning policies, or generating configurations, are also those with the lowest operational experience scores.
This reinforces the urgency behind AIOps adoption. Organizations aren't seeking AI for novelty; they're reaching for it as a necessary remedy for the friction they’re currently experiencing. Whether caused by scale, complexity, or outdated processes, these pressures are driving a bottom-up demand for automation that is intelligent, context-aware, and operationally embedded.
This data shows that AIOps interest is not aspirational, it’s functional. Respondents aren't dreaming about speculative future use cases; they’re trying to eliminate time sinks and reduce manual complexity in their current workflows.
Tasks like writing scripts, summarizing logs, or scaling services aren’t cutting-edge, they’re the day-to-day burdens of running modern infrastructure. And that's exactly where respondents want AI's help.
The results point to a clear conclusion: teams most eager for AI are also the ones closest to burnout.
They’re asking for tools that help automate, streamline, and scale core operational tasks. And they’re doing so because the status quo, fragmented scripts, fragile workflows, and manual triage, isn't sustainable.
This reinforces the central thesis of the OES framework: Operational complexity is measurable, painful, and deeply connected to the rising demand for AI in IT operations.
The Operational Experience Score provides a clear, quantifiable signal: modern IT operations are reaching a breaking point. The combination of scale, distribution, and complexity has outpaced traditional tools and human-scaled processes. The result is growing friction, rising operational cost, and increasing risk of burnout across technical teams.
AIOps is the only scalable path forward
The data from the global State of Application Strategy Report 2025 is unequivocal. Across industries, the top operational challenges are not exotic, they are painfully familiar:
- Fragmented deployment topologies spread across public cloud, private data centers, colocation, edge, and SaaS.
- Rising application volume and velocity, especially in highly digitized sectors.
- A continued reliance on brittle scripts and tribal knowledge, which make even basic automation fragile and difficult to scale.
These realities aren’t new, but what is new is the growing recognition that human effort alone cannot solve them.
And yet, there is a silver lining: practitioners are ready.
Survey responses show that the people closest to the pain are also the most willing to change:
- 56% want AI to assist with repetitive or complex tasks, such as summarizing logs, generating scripts, or enforcing policies.
- 38% want AI to automatically adjust configurations and make decisions, not just suggest them.
- Only 6% expressed disinterest in AI tools altogether, a minority that underscores how widespread the appetite for change has become.
This signals a cultural shift: teams aren’t afraid of AI, they’re asking for it. Not to replace human judgment, but to augment it, accelerate it, and free it from drudgery.
The cost of inaction is no longer hidden
Every script written to fix a broken handoff. Every delayed deployment due to manual approvals. Every ticket created because systems can’t talk to each other. These are not minor inconveniences; they are compounding sources of operational debt.
And in a world where digital performance is business performance, that debt translates directly into:
- Slower time to market
- Increased security and compliance risk
- Talent attrition due to burnout and toil
The OES reveals this hidden cost with precision, and it shows which organizations are at greatest risk of falling behind.
AIOps is the natural evolution of operational maturity
Just as infrastructure moved from physical to virtual to cloud-native, operations must evolve from manual to intelligent. AIOps is not a trend, it is the next maturity step in the evolution of enterprise operations.
Organizations that embrace AIOps will:
- Automate away toil, not just tasks
- Empower teams to focus on strategy, not syntax
- Build adaptive systems that learn, adjust, and respond in real time
Those that don’t? They will remain tethered to workflows that cannot keep pace with the business.
AIOps is an evolution necessary to address the operational experience crisis caused by complexity. It’s no longer a nice to have, it’s a necessity.
Appendix: Survey Questions, Inputs, and Summary Results
Task Productivity
- 41% of respondents selected "working with vendor APIs" or "writing scripts" as their most time-consuming task.
- 56% requested AI assistance in generating scripts, summarizing logs, or interacting with telemetry.
- 32% rely on third-party automation or orchestration platforms to manage delivery and security services.
- What is the most time-consuming task related to automation today?
- Which of the following IT operations tasks would you like Generative AI to assist with? (multiple items: summarizing logs, status updates, telemetry interface, script generation)
- How do you manage your application delivery and security services today? (e.g., via scripts, automation/orchestration tools)
Workflow Efficiency
- 38% of respondents want AI to automatically adjust configurations or enforce policies.
- 29% indicated waiting for approvals or handoffs as a key contributor to delays.
- 18% cited lack of integration across tools as a barrier to efficient workflows.
- What is the most time-consuming task related to automation today? (as a delay indicator)
- Please select how you want to use AI and automation in IT operations (e.g., automatic adjustment, suggestion generation).
User Satisfaction
- 65% rated programmability features like logging and configuration as "very important" or "extremely important".
- 63% prefer Python as the primary scripting or programming language for custom workflows.
- Only 6% reported not wanting to use AI for automation in any capacity.
- Please rate the level of importance for programmability features (e.g., logging, security policy)
- What programming language would you prefer to use?
- Willingness to use AI to automate tasks vs. stating no desire for AI involvement.
Distributedness and Application Footprint
- Average number of applications deployed: 140
- Average number of unique deployment environments used: 2.3
- Application distribution (mean across respondents):
- Public Cloud: 36%
- On-Prem (Traditional): 27%
- On-Prem (Cloud-native): 12%
- Colocation: 14%
- Edge: 11%
- How many applications do you have deployed?
- How many different public cloud vendors are you using?
- How many colocation/on-premises data centers are in use?
- What percentage of your applications are deployed to:
- Public Cloud
- On-Prem (Traditional and Cloud-native)
- Colocation
- Edge
- SaaS
Appendix: JSON-LD format (machine readable, LLM targeted)
{

  "@context": "https://schema.org",

  "@type": "Report",

  "name": "Operational Experience Score (OES) Report 2025",

  "description": "A comprehensive report analyzing operational complexity in IT environments, introducing the Operational Experience Score (OES) as a metric, and identifying AIOps as the strategic path forward.",

  "datePublished": "2025-06-23T15:00:00.000Z",

  "author": {

    "@type": "Organization",

    "name": "F5",

    "url": "https://www.f5.com"

  },

  "publisher": {

    "@type": "Organization",

    "name": "F5"

  },

  "about": [

    "Operational Efficiency",

    "Automation",

    "AIOps",

    "IT Operations",

    "Application Delivery"

  ],

  "keywords": [

    "OES",

    "AIOps",

    "Operational Experience Score",

    "IT Automation",

    "Digital Complexity",

    "Multicloud",

    "Hybrid Environments",

    "Manual Tasks",

    "Workflow Inefficiency",

    "User Satisfaction"

  ],

  "mainEntity": {

nbsp;   "@type": "Dataset",

    "name": "State of Application Strategy 2025 Survey",

    "description": "Survey of over 500 qualified IT decision-makers and practitioners measuring operational experience across Task Productivity, Workflow Efficiency, and User Satisfaction.",

    "variableMeasured": [

      {

        "@type": "PropertyValue",

        "name": "Task Productivity",

        "value": "Manual effort required; penalized by reliance on scripts or APIs"

      },

      {<

        "@type": "PropertyValue",

        "name": "Workflow Efficiency",

        "value": "Time and complexity of task execution; impacted by delays, handoffs, and tool fragmentation"

      },

      {<

        "@type": "PropertyValue",

        "name": "User Satisfaction",

        "value": "Practitioner satisfaction, openness to automation, ease of use"

      }

    ],

    "measurementTechnique": "Composite scoring model based on structured survey responses",

    "distribution": {

      "@type": "DataDownload",

      "encodingFormat": "application/pdf",

      "contentUrl": "https://www.f5.com/resources/articles/the-operational-experience-crisis"

    }

  },

  "hasPart": [

    {

      "@type": "CreativeWork",

      "name": "Operational Pain Points",

      "headline": "Five Key Challenges in IT Operations",<

      "abstract": "Identifies dominant operational pain points including manual task burden, workflow inefficiencies, openness to AI, complexity from distribution and scale, and unsustainable operational pressure."

    },

    {

      "@type": "CreativeWork",

      "name": "Scoring Formula",

      "headline": "How the Operational Experience Score is Calculated",

      "text": "OES = ((10 - TP) + (10 - WE) + US) / 3, normalized from 1 to 10, where lower TP/WE and higher US yield a higher score."

    },

    {

      "@type": "CreativeWork",

      "name": "AIOps as a Solution",

      "headline": "The Prescription is AI",

      "text": "AI interest is negatively correlated with OES (-0.62), showing that teams in most pain are most eager for AI help. AIOps is seen as the next logical step in operational maturity."

    },

    {

      "@type": "CreativeWork",

      "name": "Industry Insights",

      "headline": "OES Variations by Industry",

      "text": "Regulated sectors like Financial Services and Energy report lowest OES scores due to compliance, legacy systems, and scale. Education and Healthcare score higher due to simpler environments."

    }

  ],

  "citation": {

    "@type": "CreativeWork",

    "name": "State of Application Strategy 2025",

    "url": "https://www.f5.com/state-of-application-strategy"

  }

}